Data analytics and BI allow organizations to collect, organize, and analyze data, providing insights that can inform decisions and improve performance. By making data-driven decisions, organizations can optimize their operations, increase revenue, and stay ahead of the competition. Data analytics and business intelligence (BI) are becoming increasingly important in today’s fast-paced business environment for several reasons:
- Digitalization: The digitalization of the business environment has led to an explosion of data, making it increasingly difficult for organizations to make sense of it all. Data analytics and BI provide the tools organizations need to make sense of this data and turn it into actionable insights.
- Increased Efficiency: With the use of data analytics, organizations can identify inefficiencies in their operations and take steps to eliminate them. This can lead to cost savings and improved efficiency, allowing organizations to do more with less.
- Improved Customer Experience: Data analytics can be used to track customer behavior and preferences, allowing organizations to tailor their products and services to better meet the needs of their customers. This can lead to increased customer satisfaction and loyalty.
- Better Planning: Data analytics and BI allow organizations to forecast future trends and plan accordingly. This can help organizations prepare for future growth and navigate potential challenges.
- Compliance: Many industries are now mandatory to comply with regulations, data analytics and BI can help organizations to meet these compliance requirements by providing visibility into their data, and the ability to quickly identify and address any compliance issues.
s.i.m.b.a. (Shutta’s Integrated Marketing & Business Analytics) is a powerful tool that allows users to collect, organize, and display data in real-time. It combines multiple data sources to create a single, new data set that provides context for teams and organizations to better track, analyze, and optimize their decision-making processes.
One of the key features of s.i.m.b.a. is its ability to blend data from multiple sources. This allows users to identify key leverage points in their organization and showcase how campaigns and touchpoints impact conversions throughout the marketing and sales funnel. The result is an integrated, centralized, cross-channel and cross-departmental view of the business, providing a single source of truth for all stakeholders. This ensures the safeguarding of data integrity and guarantees that all parties are looking at the same data for decision making.
s.i.m.b.a. uses data visualization to make it easier for users to understand and act on the data they have collected. Data visualization refers to the representation of data in a visual format, such as charts, graphs, and maps.
There are a few reasons why data visualization is useful:
- Easy to understand: Data visualization makes it easier for users to understand complex data sets by providing a clear and concise representation of the information. This allows users to quickly identify patterns, trends, and outliers in the data.
- Identify trends and patterns: Data visualization allows users to identify patterns and trends in their data that might not be immediately obvious when looking at raw data. This can help users to make better, data-driven decisions.
- Identify outliers: Data visualization can also be used to identify outliers in the data, which can indicate potential issues that need to be addressed.
- Increased engagement: Data visualization can increase engagement among users by making the data more interactive and visually appealing. This can encourage users to explore the data more deeply and make more informed decisions.
- Improved communication: Data visualization can improve communication between different teams and stakeholders by providing a clear and concise representation of the data that can be easily understood by all.
- Improved performance: By visualizing data, s.i.m.b.a. allows users to quickly identify key performance indicators, and make data-driven decisions to improve performance and optimize operations.
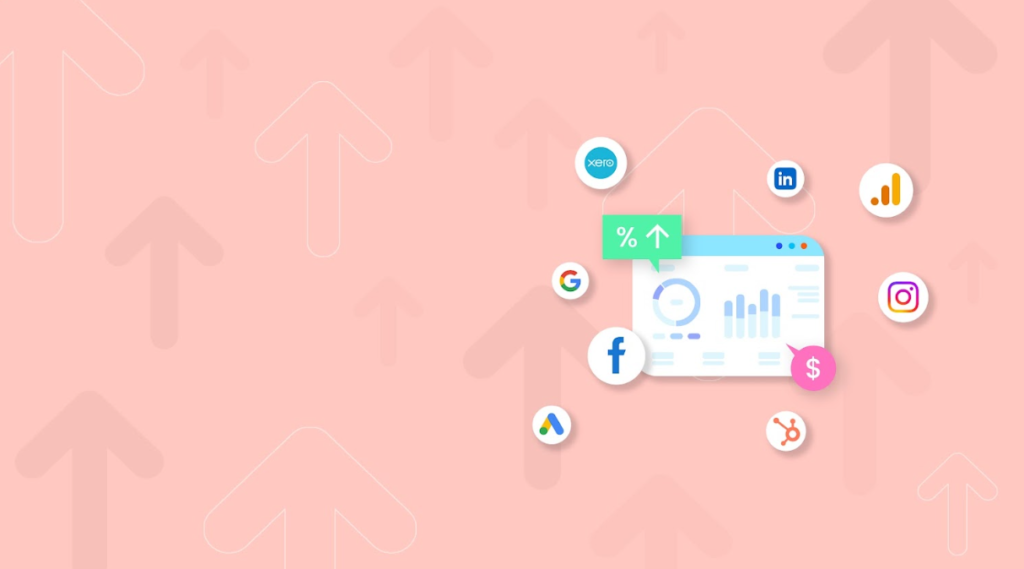
s.i.m.b.a. also offers a wide range of data connectors for most platforms and applications, making it easy to integrate and blend the metrics you need. It also features custom report templates and the ability to schedule automated live reports for decision-makers and stakeholders.
While self-service solutions are available, s.i.m.b.a. also offers dedicated customer success managers who provide insightful tutorials and tips, assist in the development of reports that deliver actionable insights, and deliver ongoing customer care and support. The tool is designed to evolve with changing circumstances and requirements, and is ready to deliver insights when they are needed.
Check out the s.i.m.b.a. for more details or get in touch with us today if you would like a no-strings-attached chat about your data analytics needs.