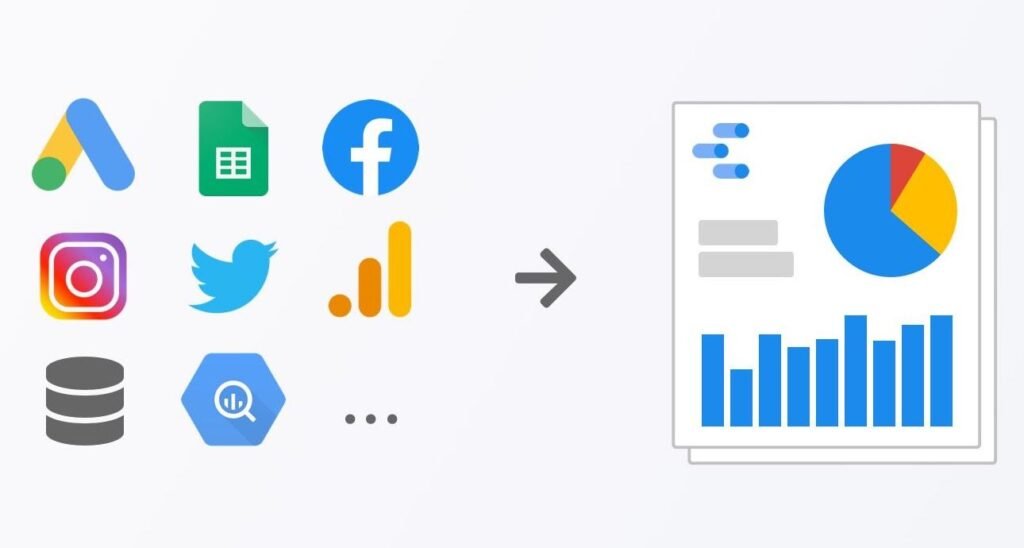
Google Data Studio is a data visualization and reporting tool that allows businesses to create interactive and customizable reports and dashboards using data from a variety of sources. The tool is part of the Google Cloud ecosystem and can be accessed with a Google account, it’s also free to use.
Data Studio allows users to connect to various data sources, such as Google Analytics, Google Sheets, BigQuery, and many more. It can also connect to external data sources via the use of a data connector, this allows users to blend data from different sources and create a single, new data set. This provides the context that allows teams and organizations to better track, analyze, and optimize their performance, ultimately making better decisions.
Once the data is connected, users can create different types of visualizations such as bar charts, line charts, and pie charts, to name a few. Data Studio also has a wide range of customization options to make the report look more polished, it also allows users to schedule automated live reports for decision-makers and stakeholders.
Data Studio provides a centralized, cross-channel and cross-departmental view of the business, this ensures the safeguarding of data integrity and guarantees all parties are looking at the same data for decision making. This also means that all stakeholders have a single source of truth, rather than relying on different data sets.
Data Studio is designed to evolve with the changing circumstances and requirements of the business. As better insights are gained, the organization can develop new visualizations and reports that the business would like to see. Data Studio dashboards are ready to deliver the insights needed, when they are needed.
Here’s a quick guide to getting started with Google Data Studio:
- Sign in to Google Data Studio: To use Google Data Studio, you’ll need to have a Google account. If you don’t have one, you can create one for free. Once you have an account, you can sign in to Google Data Studio.
- Create a new report: Once you’re signed in, you can create a new report by clicking on the “Create” button. This will open a blank report template that you can use to create your own report.
- Connect data sources: To create a report, you’ll need to connect to a data source. Google Data Studio supports a wide range of data sources, including Google Analytics, Google Sheets, and BigQuery. You can connect to a data source by clicking on the “Create a new data source” button and following the prompts.
- Add charts and tables: Once you’ve connected to a data source, you can start adding charts and tables to your report. Google Data Studio offers a wide range of chart types, such as bar charts, line charts, and pie charts. You can add a chart by clicking on the “Add a chart” button and selecting the chart type you want to use.
- Customize your report: Once you’ve added charts and tables to your report, you can customize the appearance of your report by changing colors, fonts, and other design elements. You can also add filters, calculated fields, and other data manipulation tools to your report to help you analyze your data in new ways.
- Share your report: Once you’ve finished creating your report, you can share it with others by clicking on the “Share” button. You can share your report with specific individuals or make it public so that anyone can view it.
In summary, Google Data Studio is a data visualization and reporting tool that allows businesses to create interactive and customizable reports and dashboards using data from a variety of sources. It allows users to connect to various data sources, blend data, create visualizations, schedule automated live reports and provides a centralized, cross-channel, and cross-departmental view of the business. This ensures the safeguarding of data integrity, guarantees all parties are looking at the same data for decision making.


